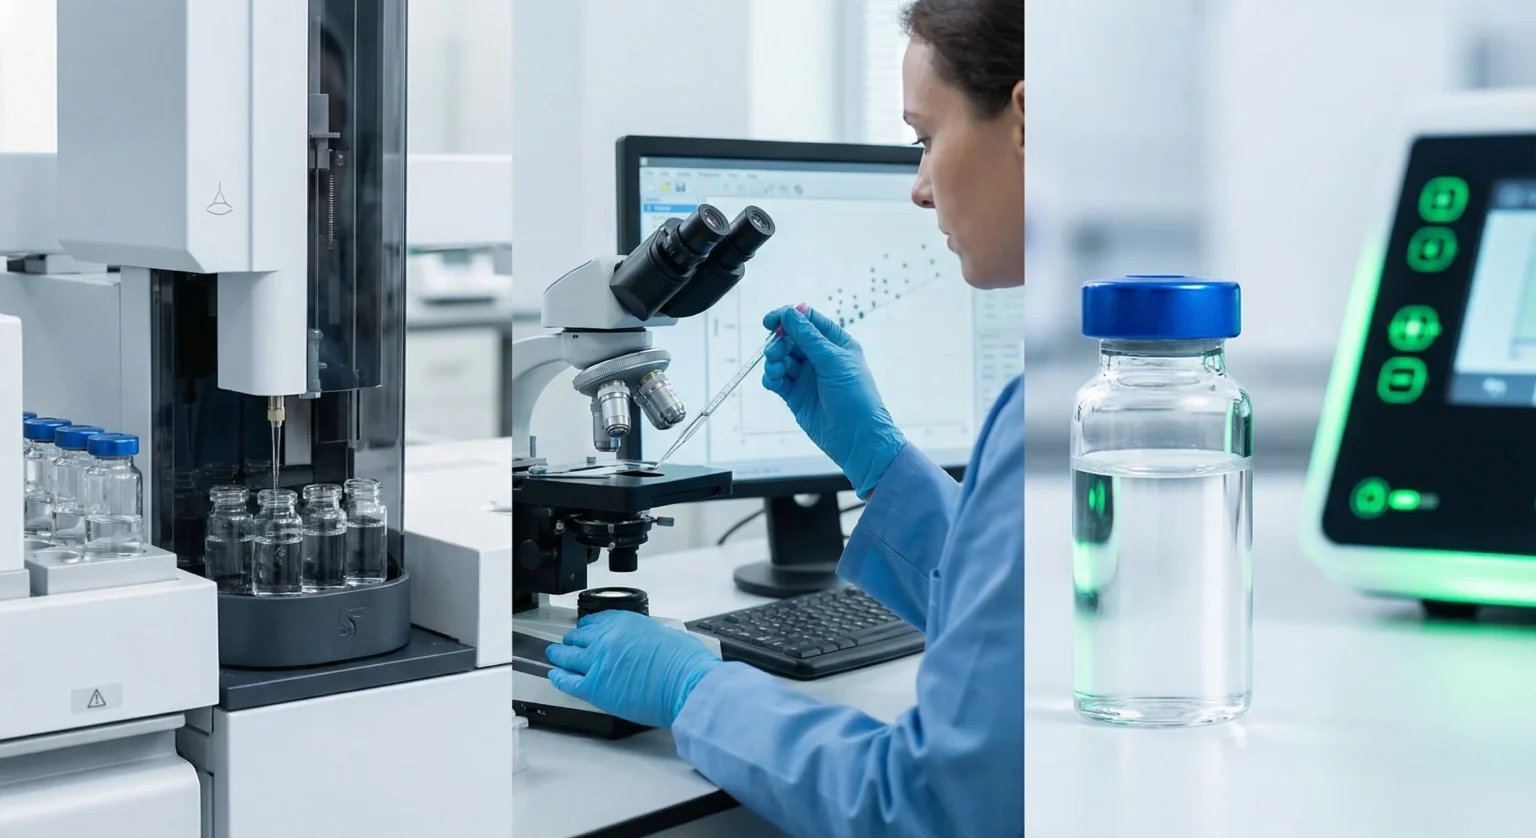
A purity figure on a peptide Certificate of Analysis states what fraction of the UV-absorbing material in a sample is the intended peptide, measured by reversed-phase HPLC. An identity result from mass spectrometry states whether the measured molecular mass matches the mass calculated from the sequence. The two tests answer different questions. NuVion Health supplies its synthetic research peptides as laboratory chemicals for in vitro research use only.
Where impurities come from
Research peptides are made by solid-phase synthesis, in which protected amino acids are coupled one at a time to a chain anchored on a resin. No coupling or deprotection step reaches exactly 100% conversion, so a crude product always contains related sequences: deletion sequences, where one residue failed to couple; truncated sequences, where a chain was capped and stopped growing; and sequences still carrying a protecting group. Side reactions add oxidised methionine or tryptophan, deamidated asparagine, aspartimide products at Asp-Gly motifs, and diastereomers from epimerisation during activation. Preparative RP-HPLC removes most of these species; what remains is what the purity test quantifies.
What an RP-HPLC purity figure measures
Reversed-phase HPLC separates molecules by hydrophobicity. The sample is loaded onto a column packed with silica particles carrying C18 chains and eluted with a gradient from water to increasing acetonitrile, both containing about 0.1% trifluoroacetic acid as an ion-pairing agent. More hydrophobic species bind the stationary phase more tightly and elute later. A UV detector set between 210 and 220 nm records the eluate; the peptide bond absorbs there, so every peptide-related species is visible whether or not it contains an aromatic residue.
The output is a chromatogram in which each resolved species appears as a peak. The purity figure comes from area normalisation: software integrates every peak, sums the areas and reports the main peak as a percentage of the total. That number carries three assumptions. It assumes all peptide-related species absorb similarly per unit mass, which holds well at 214 nm because the chromophore is the backbone itself. It assumes each impurity is resolved from the main peak; a single deletion in a 30-residue peptide, or a D-isomer at one position, can co-elute and be counted as product. And it only sees what absorbs UV. Water, trifluoroacetate counter-ions and salts pass through undetected, so the figure says nothing about how much of the mass in the vial is peptide. That quantity, the net peptide content, needs a separate measurement such as amino acid analysis.
What a mass spectrometry identity result means
Mass spectrometry measures mass-to-charge ratio, m/z. With electrospray ionisation the peptide picks up one or more protons and appears as a series of ions [M+nH]n+ at m/z values of (M+n)/n, where M is the neutral mass. Deconvolution of that series gives the observed mass, which is compared with the theoretical mass calculated from the molecular formula of the intended sequence, either monoisotopic or average depending on the resolution of the instrument. Agreement within the mass tolerance of the instrument is reported as a pass.
The match shows that the dominant species has the elemental composition of the intended peptide. It does not show the order of the residues, because the same residues in a different order have the same mass, and it does not show stereochemistry, because a D-amino acid substitution changes nothing in the formula. Sequence order can be confirmed by tandem mass spectrometry, where the parent ion is fragmented and the fragment ladder is read against the sequence, but that is not part of a routine identity test. The two results are read together: HPLC says how much of the sample is the main peak, and MS says the main peak has the right mass.
Reading a Certificate of Analysis
A Certificate of Analysis reports the tests carried out on a specific batch, identified by a batch reference that should match the vial label. In the RP-HPLC section, note the retention time of the main peak, the reported area percent and the size of the largest secondary peak; one dominant peak with small, well separated minor peaks is what a properly purified peptide looks like. In the mass spectrometry section, compare the observed mass with the calculated mass. Note the laboratory that ran the tests, the column, gradient and wavelength used, and the test date.
NuVion Health has its peptides tested independently by Janoshik Analytical, with purity by RP-HPLC and identity by mass spectrometry. Most batches are tested, and the certificate for a tested batch is published on the product page and in the Certificates of Analysis library. Manufacture is GMP-audited, and the peptides are supplied lyophilised in sealed vials and dispatched from within Australia.
Using the figures in experimental work
When the label mass is converted to a molar concentration, the purity figure corrects for peptide-related impurities and the net peptide content, where known, corrects for water and counter-ions; both make the true concentration lower than the nominal one. In a receptor binding or reporter assay, related sequences can be inactive, weakly active or antagonistic, so lower purity widens the uncertainty in the measurement. The reconstitution calculator works from the label mass and the volume of bacteriostatic water added.
Frequently asked questions
What is the difference between purity and net peptide content?
Purity by RP-HPLC compares the peptide with its peptide-related impurities. Net peptide content is the mass of peptide as a fraction of the total mass of the lyophilised solid, which also contains water and counter-ions.
Can RP-HPLC alone confirm the identity of a peptide?
No. A retention time shows only that a species has a certain hydrophobicity under a given method. Identity needs a mass measurement, and full sequence confirmation needs tandem mass spectrometry or Edman sequencing.
Why do purity figures differ between laboratories?
Area-percent purity depends on the method. A steeper gradient, a different column chemistry, a different wavelength or a different integration threshold each change how many minor peaks are resolved and counted, so two laboratories can report different figures for the same vial without either being wrong.
Are NuVion research peptides therapeutic goods in Australia?
No. NuVion Health supplies its peptides as laboratory chemicals for in vitro research use only, and they are not sold or presented as therapeutic goods. The notice below sets out their regulatory position.
Browse the NuVion research peptide catalogue.
View productsResearch use only. This product is a laboratory chemical supplied for in vitro research. It is not included in the Australian Register of Therapeutic Goods and has not been assessed by the Therapeutic Goods Administration for quality, safety or efficacy. It is not for human or veterinary use, and nothing on this page is a representation about therapeutic use.